
Modern software systems are complex. They run in the cloud. They scale up and down. They talk to dozens of services at once. When something breaks, it can feel like looking for a needle in a digital haystack.
That’s where observability tools come in. They help you see what’s happening inside your systems. In real time. With context. With clarity.
TL;DR: Observability tools help you understand what’s happening inside your applications and infrastructure. They collect logs, metrics, and traces to give you deep system insights. Tools like Prometheus, Grafana, Datadog, New Relic, and Jaeger make it easier to detect issues, debug faster, and improve performance. If you want fewer outages and happier users, these tools are your best friends.
Let’s break it down in a simple and fun way.
First, What Is Observability?
Imagine your system is a car.
You don’t just want to know that it stopped working. You want to know:
- How fast was it going?
- Was the engine overheating?
- Was fuel running low?
- Did something strange happen 5 minutes before it stopped?
Observability gives you those answers.
In tech terms, observability is based on three main pillars:
- Metrics – Numbers that show performance (CPU usage, memory, response time).
- Logs – Detailed event records.
- Traces – End-to-end journeys of requests across services.
Together, they give you deep system insight.
Now, let’s look at five powerful tools that make this magic happen.
1. Prometheus – The Metrics Master
Prometheus is like a fitness tracker for your system.
It constantly collects numerical data from your services. That includes:
- CPU usage
- Memory consumption
- Request counts
- Error rates
It is especially popular in cloud-native and Kubernetes environments.
Why people love it:
- Powerful query language (PromQL)
- Built-in alerting
- Strong Kubernetes integration
- Open-source and widely supported
With Prometheus, you can ask questions like:
“What was the average response time of this service in the last 10 minutes?”
And you get an answer fast.
It works by pulling metrics from configured endpoints. Then it stores them as time-series data. That means you can track changes over time and notice patterns.
Prometheus is not flashy. But it is powerful.
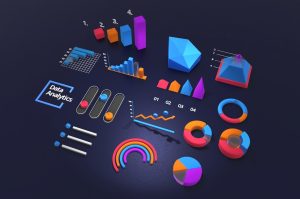
2. Grafana – The Visualization Wizard
Prometheus gives you data. Grafana makes it beautiful.
Grafana is a visualization platform. It connects to data sources like Prometheus and turns raw numbers into:
- Colorful graphs
- Interactive dashboards
- Heatmaps
- Status panels
Think of Grafana as the artist of observability.
Why it stands out:
- Easy-to-build dashboards
- Supports many data sources
- Real-time updates
- Custom alerts and notifications
Instead of staring at logs, you can glance at a dashboard and instantly see:
- Where traffic is spiking
- If latency is rising
- Whether error rates are growing
It reduces guesswork.
It also makes sharing insights easier. Teams can align around the same visual data. No confusion. No arguing over spreadsheets.
When paired with Prometheus, Grafana becomes a dream team.
3. Datadog – The All-in-One Powerhouse
If Prometheus is a fitness tracker, Datadog is a full medical lab.
Datadog is a cloud-based observability platform. It combines:
- Metrics
- Logs
- Traces
- Security monitoring
- Infrastructure visibility
All in one place.
This means you don’t need to stitch together multiple tools. It’s integrated from the start.
Key benefits:
- Fast setup
- Clean interface
- AI-powered anomaly detection
- Hundreds of built-in integrations
Imagine a spike in error rates.
With Datadog, you can:
- See the metric spike.
- Jump into related logs.
- Follow the trace of a failing request.
- Identify the exact service causing trouble.
No tool switching. No context loss.
This deep linking between telemetry types is powerful. It shortens debugging time. And that means less downtime.
4. New Relic – Full-Stack Clarity
New Relic focuses heavily on full-stack observability.
That means it covers everything from:
- Frontend user experience
- Backend services
- Databases
- Infrastructure
It connects technical performance with real user impact.
For example, it can show you:
- Which pages are loading slowly
- Which API calls are the bottleneck
- How database queries affect response times
What makes it powerful:
- Application Performance Monitoring (APM)
- Real user monitoring
- Distributed tracing
- Custom dashboards
You don’t just see that something failed.
You see who it affected and how badly.
That’s deep insight.
This is especially useful for product teams. It helps prioritize fixes based on user impact. Not just technical severity.
New Relic turns raw telemetry into business intelligence.
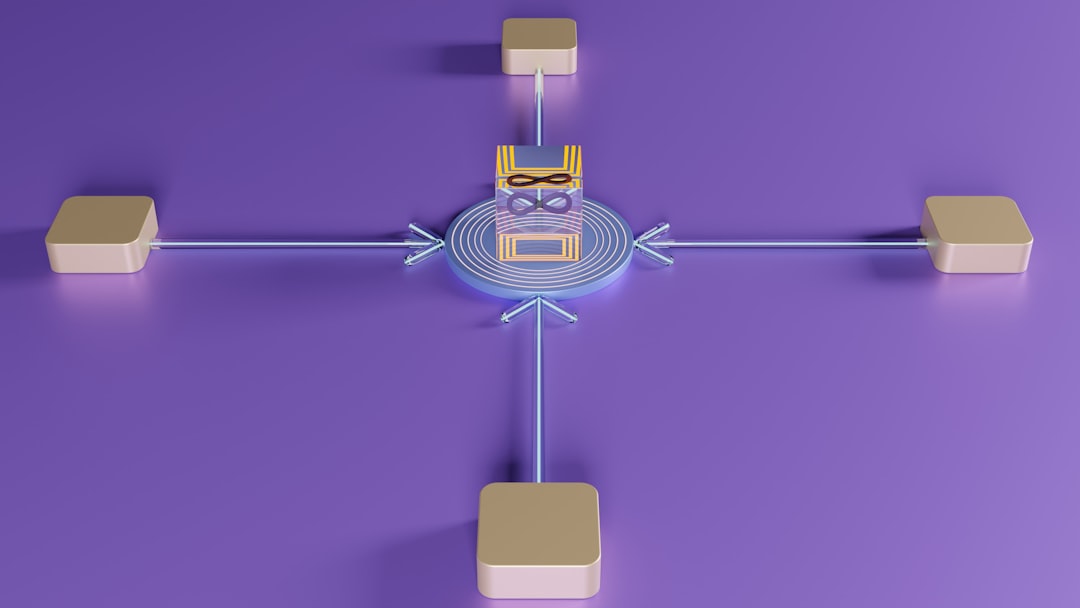
5. Jaeger – The Trace Detective
Modern systems often use microservices.
That means one user request might travel through:
- An API gateway
- Authentication service
- Payment service
- Inventory service
- Database
If something slows down, where do you look?
That’s where Jaeger shines.
Jaeger is a distributed tracing system. It shows the full journey of a single request across services.
Why it matters:
- Identifies latency bottlenecks
- Visualizes service dependencies
- Helps debug microservices
- Works well with Kubernetes and cloud-native apps
With Jaeger, you can see a timeline:
- This service took 20ms
- That one took 150ms
- The database query took 300ms
Now the slow part is obvious.
No guessing needed.
Jaeger is often combined with other tools like Prometheus and Grafana. Together, they give you metrics, traces, and visualization in one open-source stack.
How These Tools Work Together
You don’t always need just one.
Many teams build an observability stack like this:
- Prometheus for metrics
- Grafana for dashboards
- Jaeger for tracing
- Centralized logging system
Or they choose an all-in-one solution like Datadog or New Relic.
The key is not the brand.
The key is visibility.
When you can see:
- What is happening
- Why it’s happening
- Who is affected
- And how to fix it fast
You move from reactive to proactive.
You stop fighting fires.
You start preventing them.
Why Deep System Insight Matters
Without observability:
- You rely on user complaints.
- You scramble during outages.
- You guess at root causes.
With observability:
- You detect issues early.
- You reduce mean time to resolution (MTTR).
- You improve system reliability.
- You build user trust.
It also empowers developers.
Instead of fearing production bugs, they can explore real data. They can test hypotheses. They can improve performance confidently.
In short, observability turns chaos into clarity.
Final Thoughts
Software is only getting more complex.
Microservices. Containers. Serverless. Distributed systems everywhere.
You can’t manage what you can’t see.
Tools like Prometheus, Grafana, Datadog, New Relic, and Jaeger help you see deeply. Not just surface-level stats, but real insights into system behavior.
Start simple.
Pick one tool. Explore your metrics. Build a dashboard. Follow a trace.
Once you see your system clearly, you’ll never want to go back.
Because deep system insight is not a luxury anymore.
It’s a necessity.