
In the rapidly evolving world of data-driven decision-making, Business Intelligence (BI) plays a crucial role in helping organizations make informed choices. However, mastering BI tools and techniques requires hands-on experience. One of the most effective ways to gain practical skills is by working with public datasets. These datasets are often freely available and provide a treasure trove of real-world information to explore and analyze. In this article, we will dive into various engaging BI exercises using public datasets from three major sectors: finance, retail, and health.
Why Use Public Datasets?
Public datasets are accessible, diverse, and often of high quality. They are published by government agencies, international organizations, and research institutions. BI professionals can use these datasets to simulate real-world business challenges without needing proprietary company data. This is particularly useful for students, aspiring analysts, and businesses looking to prototype or test BI processes.
Preparing for BI Exercises
Before you dive into BI exercises, make sure you’re equipped with the following tools and skills:
- BI Tools: Familiarity with Power BI, Tableau, or Microsoft Excel is essential for interactive visualization and reporting.
- SQL Knowledge: Many public datasets come in relational formats; understanding SQL helps in querying and transforming the data.
- Data Prep Skills: Knowing how to clean, transform, and prepare data is critical for meaningful analysis.
- Storytelling Ability: The ability to turn insights into a compelling narrative is what separates data pros from the rest.
Finance Sector: Analyzing Stock Market Data
The finance sector is rich in public data sources, making it ideal for hands-on BI practice. A great starting point is the Kaggle dataset containing stock prices from the S&P 500 or NASDAQ, or data from Yahoo Finance and Alpha Vantage APIs.
BI Exercise: Building a Stock Performance Dashboard
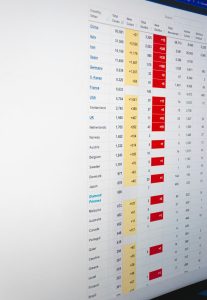
Your goal in this exercise is to evaluate the performance of multiple stocks over time and compare key metrics like volatility, returns, and volume trends.
Steps:
- Download historical data for 5-10 stocks over the last 5 years.
- Import the data into Power BI or Tableau.
- Create calculated fields: e.g., percentage change, moving average, or volatility index.
- Design a dashboard that includes:
- Time series line chart of stock prices
- Heatmap of daily returns by stock
- Filter controls by company or date

Learning Outcome: After completing this exercise, you’ll gain proficiency in time series analysis, data transformation, and interactive dashboard design—all essential financial BI skills.
Retail Sector: Customer Behavior and Sales Trends
The retail industry thrives on customer insight. Public datasets like those from the UCI Machine Learning Repository or Kaggle’s “Online Retail” dataset provide anonymized transactional data that captures customer IDs, country, invoice dates, products, and quantities purchased.
BI Exercise: Sales Trend and Segmentation Analysis
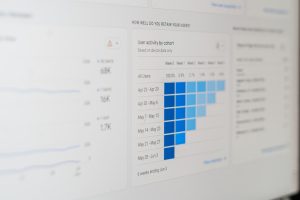
This exercise guides you in analyzing sales performance over time and performing customer segmentation using RFM (Recency, Frequency, Monetary) analysis.
Steps:
- Clean data by removing null invoices and returns.
- Create metrics: revenue per invoice, number of items, customer lifetime value.
- Develop an RFM scoring model to categorize customers.
- Design a report including:
- Monthly sales charts
- Top customers and products
- Customer cohort and retention analysis

Learning Outcome: You’ll build up skill sets in cohort analysis, customer segmentation, and sales forecasting, which are crucial in a retail BI analyst role.
Healthcare Sector: Public Health Analytics
Public health data offers opportunities for meaningful analysis that can have social impact. Repositories like HealthData.gov or the CDC provide datasets related to disease prevalence, vaccination rates, or hospital performance.
BI Exercise: Analyzing COVID-19 Trends
This historical BI challenge involves evaluating COVID-19 data to understand its impact on different regions over time.
Steps:
- Use datasets from Johns Hopkins, WHO, or CDC.
- Aggregate confirmed cases, deaths, and vaccination data.
- Create calculated fields: case fatality rate (CFR), growth rates, and testing positivity.
- Design a dashboard with:
- Time-series graphs of new cases by country/state
- Heatmaps of regional case loads
- Charts comparing vaccination coverage and infection rate

Learning Outcome: Apart from developing technical skills, working on healthcare datasets nurtures the ability to analyze and visualize data that directly impacts public welfare.
Tips for Better BI Projects with Public Data
Doing BI projects with public datasets can be enjoyable and highly educational. Here are some tips to make the most of them:
- Focus on Real Problems: Tie your visualizations to genuine business questions or challenges.
- Tell a Story: Use dashboards to walk users through a narrative—from context to insight to action.
- Document Everything: Especially when dealing with multiple data sources, clarity in documentation helps you or your collaborators trace logic behind visuals.
- Update Regularly: If the dataset is frequently updated, automate data refresh pipelines.
Recommended Public Data Portals
If you’re ready to start exploring, here are some excellent places to find data:
- Data.gov – Wide range of U.S. government datasets
- Kaggle Datasets – Community-powered, diverse topics
- Data.world – A collaborative data-sharing platform
- WHO Global Health Observatory – International health statistics
- FRED (Federal Reserve Economic Data) – US economic indicators
Conclusion
Leveraging public datasets for BI exercises allows you to practice critical skills in a real-world context. Whether it’s dissecting the stock market, exploring buyer behavior, or analyzing public health emergencies, each dataset is a chance to tell a story with data. As BI continues to be a cornerstone of informed decision-making, those who can navigate and translate public data sources into actionable insights will be ahead of the curve.
So, fire up your favorite BI tool, download a dataset that excites you, and start exploring! The next breakthrough insight might just be a dashboard away.